Can LLMs predict steel properties
from chemical composition?
An open benchmark scoring large language models against real CATRA and Charpy laboratory measurements of knife-steel performance.
The setup
We give a model only a steel's chemistry
(e.g. C=1.9%, Cr=20%, V=4%, powder-metallurgy: yes) and ask it to
rate two properties on a 1–10 scale. We then score those ratings against
objective measurements — never subjective opinion:
Edge retention
Ground truth: CATRA standardized machine-cutting test (total card stock cut, mm). 48 steels.
Toughness
Ground truth: Charpy impact energy (ft-lbs). 12 steels.
Scoring is scale-free (Spearman rank correlation + pairwise ranking accuracy), so a model is judged only on whether it orders steels correctly — the decision-relevant question — not on how it calibrates 1–10. Zero-shot, temperature 0, one sample per steel, identical prompt for every model.
Leaderboard
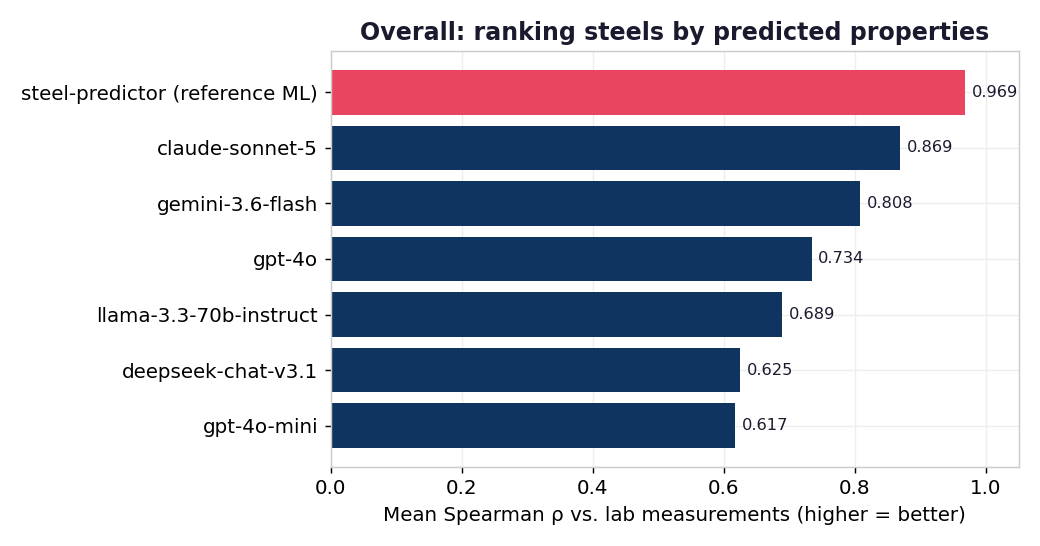
| Model | Edge ρ | Tough ρ | Mean ρ |
|---|---|---|---|
| steel-predictor (reference ML) † | 0.992 | 0.946 | 0.969 |
| anthropic/claude-sonnet-5 | 0.894 | 0.844 | 0.869 |
| google/gemini-3.6-flash | 0.918 | 0.698 | 0.808 |
| openai/gpt-4o | 0.868 | 0.600 | 0.734 |
| meta-llama/llama-3.3-70b-instruct | 0.864 | 0.514 | 0.689 |
| deepseek/deepseek-chat-v3.1 | 0.869 | 0.380 | 0.625 |
| openai/gpt-4o-mini | 0.850 | 0.385 | 0.617 |
Finding 1 — edge retention is easy, toughness is hard
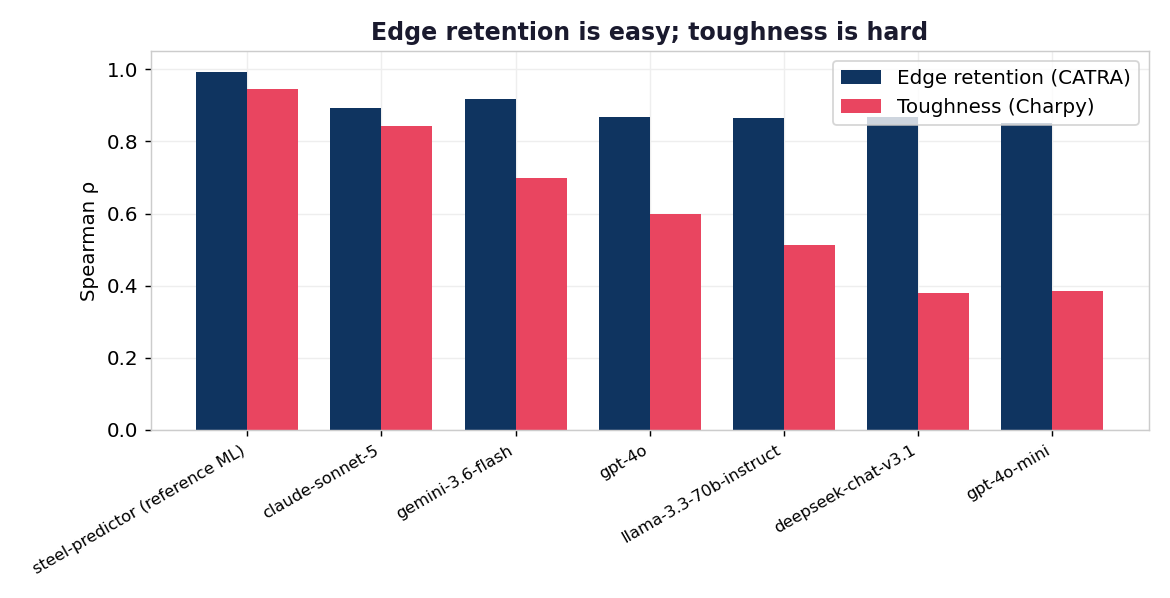
Wear resistance is close to a function of composition — it's dominated by hard carbide volume, which is set by carbide-forming elements (C, V, Cr, W, Mo). That relationship is legible and heavily documented, exactly what an LLM can internalize.
Toughness is a competition, not a sum. It depends on carbide size and distribution, powder-metallurgy processing, retained austenite, and the hardness the steel is run at — factors a bare composition string underdetermines. High carbon and vanadium raise wear resistance while lowering toughness, so naive "more alloy = better" reasoning breaks down.
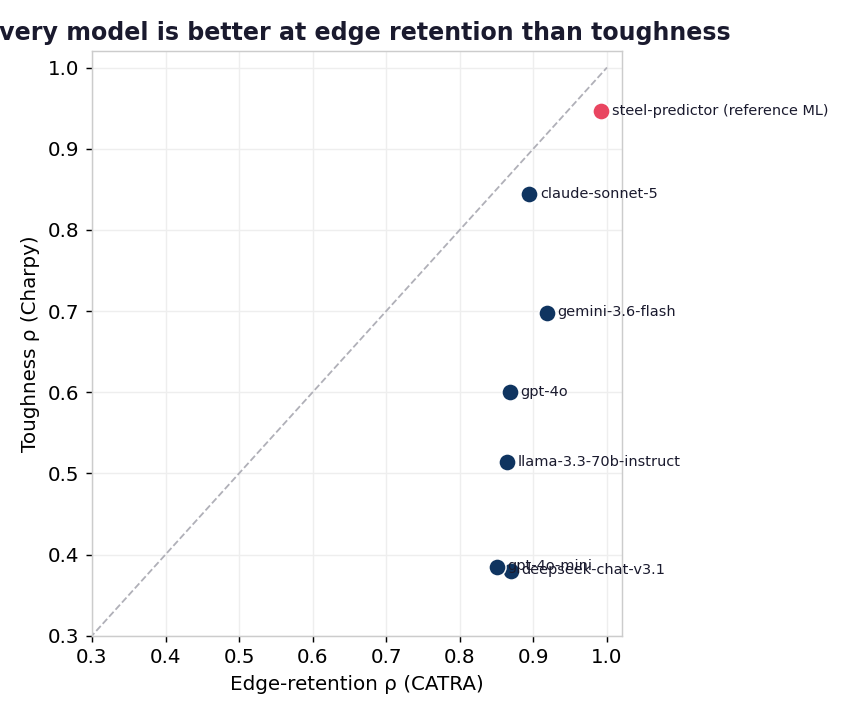
Finding 2 — frontier models separate on the hard task
On edge retention the field is bunched (ρ 0.85–0.92); even a small model orders
steels well. The separation appears on toughness, where
claude-sonnet-5 (0.844) and gemini-3.6-flash (0.698) pull
clear of gpt-4o-mini and deepseek-chat-v3.1 (both ≈0.38).
Toughness is the discriminating task.
Finding 3 — the best LLM tracks the measurements
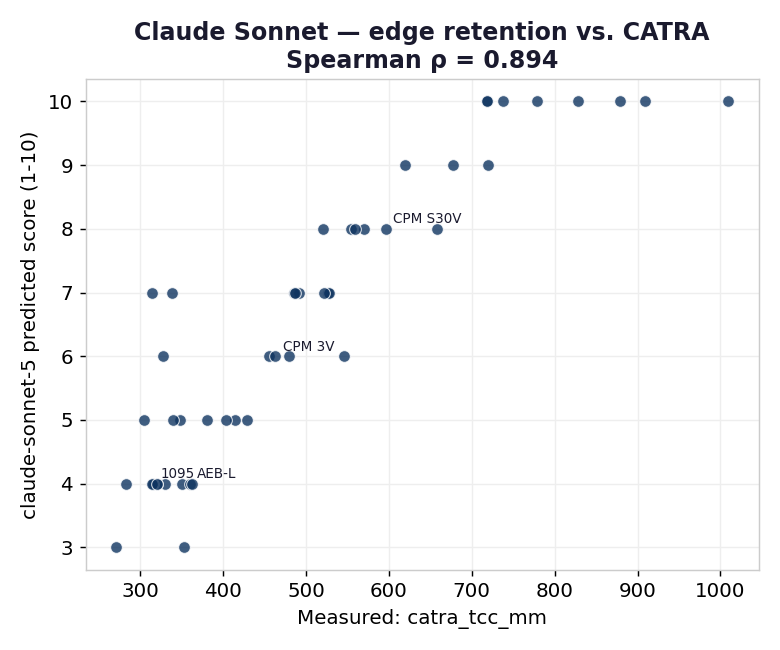
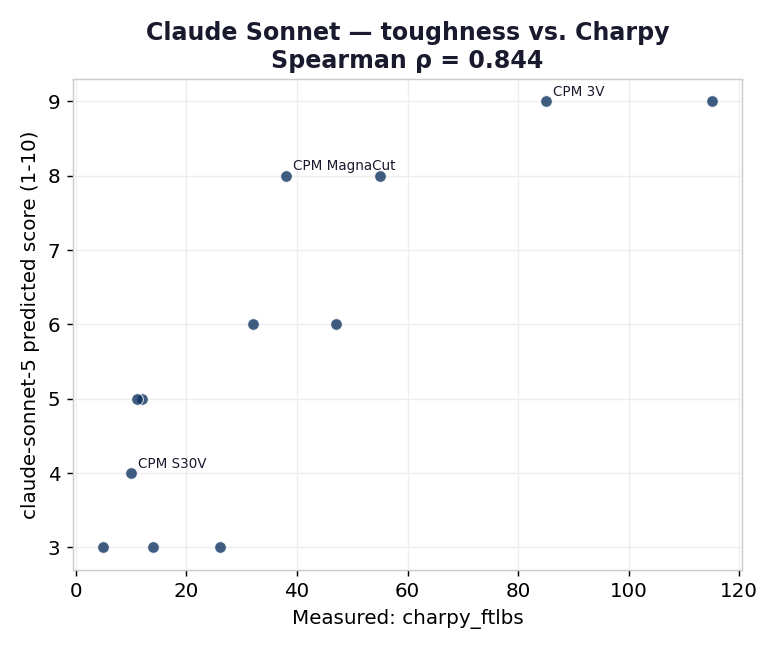
For Claude Sonnet, predicted scores rise monotonically with the measured values on both properties. The toughness scatter also exposes the failure mode: several genuinely tough steels get compressed into low scores because the model hedges toward the middle when chemistry alone is ambiguous.
What this does and doesn't show
It does show modern LLMs carry a real, quantifiable amount of materials knowledge — enough to rank wear resistance about as well as a purpose-built model, from composition alone.
It doesn't show LLMs can replace a measured model or lab testing: toughness ordering is unreliable, magnitudes aren't calibrated, and none of this accounts for heat treatment or geometry. See the methodology for the full limitations.
Reproduce it
git clone https://github.com/Steel-predictor-project/steel-llm-eval.git
cd steel-llm-eval
export OPENROUTER_API_KEY=...      # one key → many providers
./run_benchmark.sh                 # run all models + rebuild the leaderboard
python harness/generate_charts.py  # regenerate these figures
Raw per-steel model responses are committed under results/. Full method:
methodology · results & analysis.